Why Isn’t my Program Working Harder?
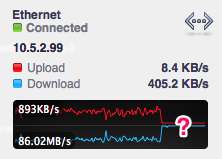
In my efforts to saturate my network with cbfs, I kept noticing lulls in my graphs – both the seriesly and the OSX widget I use showing me what my computer’s doing. I decided to figure out what the client is doing when it’s supposed to be breaking my networks.
The cbfsclient download tool does three passes against the cluster to figure out what to do:
- The first translates the path you requested to a tree of filenames and object IDs (typically sha1 hashes).
- The second finds current locations of all of those objects.
- The third just starts flipping through all of those objects and asking one of the origin servers at random to stream it down.
As all requests are against origin servers, it should almost always
just be a straight up sendfile.
So how do I find out what’s going on? netstat wasn’t really useful –
it just told me that my client didn’t have anything to do, but had a
few connections open.
The thing I really want to know is exactly what HTTP requests are currently in flight and how long they’ve been in flight. However, I only want to know this when I observe behavior to be weird.
Enter SIGINFO
SIGINFO is awesome. On BSD systems, ^T sends SIGINFO to the
process currently attached to the terminal. A few programs
(e.g. dd) have built-in SIGINFO handlers that give you useful
information on long-lived processes.
^T doesn’t work on Linux. I don’t know why and explaining that is
beyond the scope of this post, but I’m not developing on Linux, so
back to the lecture at hand.
Signals in UNIX are essentially messages delivered to the process, but the UNIX APIs for signal handling involve registering a function to be called when the signal is available for processing. This is unfortunate because most things you’d be tempted to do in a signal handler are unsafe.
In go, signals are delivered to a channel. A goroutine reading from that channel can safely do anything any other goroutine can do.
The most simple example of SIGINFO, at least on OS X, is as follows:
package main

import (
	"log"
	"os"
	"os/signal"
	"syscall"
)

// SIGINFO isn't part of the stdlib, but it's 29 on most systems
const SIGINFO = syscall.Signal(29)

func main() {
	ch := make(chan os.Signal, 1)
	signal.Notify(ch, SIGINFO)

	go func() {
		for _ = range ch {
			log.Printf("You pressed ^T")
		}
	}()

	select {}
}
You can read more on go signal handling either in the docs or wiki.
Now Do Something Useful
I spent a few minutes replacing the http RoundTripper for
the default client for my program with one that would keep track of
the beginning of every HTTP request through the Close() of the
response body.
Then I ran my program again. Once I saw another lull, I pressed ^T
and, ah ha!
load: 1.45  cmd: cbfsclient 14765 running 47.14u 145.92s
In-flight HTTP requests:
  servicing "http://slownode:8484/.cbfs/blob/[oid]" for 1m34.00s
  servicing "http://slownode:8484/.cbfs/blob/[oid]" for 1m31.67s
  servicing "http://slownode:8484/.cbfs/blob/[oid]" for 1m32.08s
  servicing "http://slownode:8484/.cbfs/blob/[oid]" for 1m33.67s
  servicing "http://slownode:8484/.cbfs/blob/[oid]" for 1m34.06s
  servicing "http://slownode:8484/.cbfs/blob/[oid]" for 47.26s
This program was only allowing 6 concurrent requests and they were all stuck doing requests against the same slow node. It’s so obvious when you can see it.
Code?
I threw this together in about fifteen minutes just to debug this current
situation, but I’ve got it down to initHttpMagic() in cbfsclient’s
httpmagic.go.
It’s not well documented at this point because, well, I spent ~15 minutes on it to solve my problem. The basic theory is pretty straightforward, though:
- Every time we start a request, record the URL and timestamp.
- Every time the response body is closed, forget about that URL.
- When
^Tis pressed, dump out the current map.
(Do note that I don’t ever have two requests to the same URL, so I’m not worried about losing that information.)
Good luck, out there.
