Why so, Seriesly?

So, I started writing a document-oriented time-series database in go two weeks ago. It’s really nothing groundbreaking, but it’s been quite fun.
My purpose is to have a system that allows me to store arbitrary performance data captured as it’s seen in the wild, and then later come up with ways to look at it.
Check out this real life example to get a feel for the kinds of captures we’re working with. This sample represents a single point in time, there may be many of these occuring at any frequency (well, nothing more frequent than once per nanosecond). From this, we can do arbitrary queries and report groupings at millisecond granularity.
Usage
The seriesly wiki describes in detail all that can be done with it, but the general strategy is the following:
- Capture lots of data.
- Query the data.
An important goal is to make it this simple in practice.
Capturing Data
Captured data is submitted to a database and recorded with a timestamp. The timestamp may be generated by the system, or may be supplied at request time (which is useful for backfilling data).
Querying Data
Querying captured data is about taking data from a specific time range, grouping it into specific time chunks (e.g. 5 minutes worth of data at a time) selecting keys from the data (using json-pointer) to query on and performing reductions over the values selected using those keys.
The following diagram shows an example query and how the fields are
selected and values are returned (conceptually). For this query, I’ve
asked for the count of /a, the avg of /c/e and the min of /b/2
grouped in 5 minute windows (300 seconds).
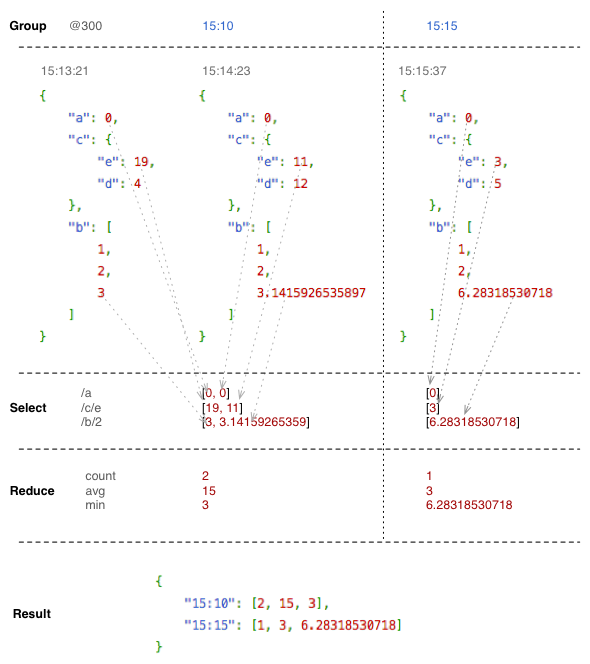
(The key in the result does not represent the actual key that will be emitted. I used a human-readable time representation for illustration purposes only. Had this been an actual query, the timestamps would’ve all been absolute and emitted as the number of milliseconds since UNIX epoch.)
Web Stuff
I use cubism for a lot of my time series fun. You can see an example of this backed by seriesly at my thermometers page at home. Seriesly is designed after building query interfaces to cubism for other systems. There’s no impedene mismatch between what cubism wants to know and the query language provided by seriesly.
Other than the normal cubism configuration and styling, the code to fetch data for display is pretty straightforward:
// First, point it to your data
var baseUrl = "http://my.seriesly.host/",
    dbname = "mydb",
    pointer = "/some/json/pointer",
    reducer = "avg",
    lbl = "Label for my Metric";

// Then get a seriesly metric source:
var sr = context.seriesly(baseURL);

// And then your specific metric you want to plot:
var myMetric = sr.metric(dbname, pointer, reducer, lbl);

// Then plot it like you would any other metric:
d3.select(here).selectAll(".horizon")
    .data(things.map(function(x) { return myMetric; }))
  .enter().insert("div", ".bottom")
    .attr("class", "horizon")
    .call(context.horizon());
A comparison of a metric against itself is just like you’d expect:
// Get a metric and compare it to the same data a week ago.
var primary = sr.metric(dbname, pointer, reducer),
    secondary = primary.shift(-7 * 24 * 60 * 60 * 1000);

// Then do the compare thing.
d3.select(here).selectAll(".comparison")
    .data([[primary, secondary]])
  .enter().append("div")
    .attr("class", "comparison")
    .call(comparison);
For complete examples, check out my temperature plots and view source. series.js has all the details.
Using It
Within a few days of starting the project, I had around fifteen million data points loaded and querying. Today marks the first fortnight birthday of the system and I’ve moved from the “make it work correctly” phase to the “make it fast” phase.
I think I’ve been doing pretty well. When I started, every query like this was taking over two minutes:
Completed query processing in 5.7s, 1,894,473 keys, 1,396 chunks
I’ve still got a couple things I want to do that I haven’t yet, but for the most part, I’m just looking for more experience with it.
Further Reading…
I hope to write more about how some of the implementation since go made it possible to do some things that are quite difficult in other languages. Particularly, modeling the query execution concurrency and parallelism made it a lot easier to take the working software and make it run faster and efficiently use all the resources I could throw at it.
In the meantime, check out the seriesly project page to get the software, file bugs (including new ideas), contribute changes and all that.


